
Emissions reduction: our progress in 2024, strengthened targets for 2025
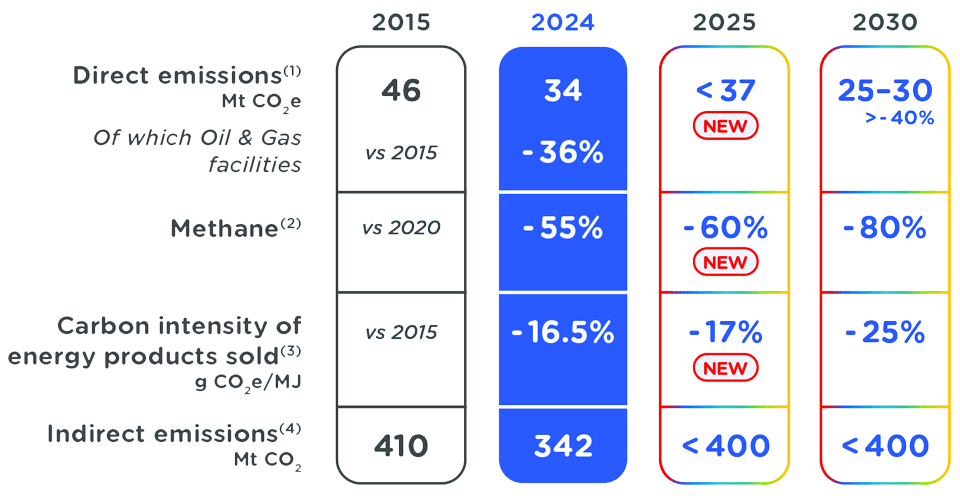
| 2015 | 2024 | 2025 | 2030 | |
|---|---|---|---|---|
| Direct emission(1)Mt CO2e | Direct emission(1)Mt CO2e 2015 Direct emission(1)Mt CO2e2015 46 |
Direct emission(1)Mt CO2e 2024 Direct emission(1)Mt CO2e2024 34 |
Direct emission(1)Mt CO2e 2025 Direct emission(1)Mt CO2e2025 < 37 NEW |
Direct emission(1)Mt CO2e 2030 Direct emission(1)Mt CO2e2030 25-30 > - 40% |
| Of which Oil & Gas | Of which Oil & Gas 2015 Of which Oil & Gas2015 VS 2015 |
Of which Oil & Gas 2024 Of which Oil & Gas2024 - 36% |
Of which Oil & Gas 2025 Of which Oil & Gas2025
|
Of which Oil & Gas 2030 Of which Oil & Gas2030
|
| Methane(2) | Methane(2) 2015 Methane(2)2015 VS 2020 |
Methane(2) 2024 Methane(2)2024 - 55% |
Methane(2) 2025 Methane(2)2025 - 60% NEW |
Methane(2) 2030 Methane(2)2030 - 80% |
| Carbon intensity of energy product sold(3) g CO2e/MJ | Carbon intensity of energy product sold(3) g CO2e/MJ 2015 Carbon intensity of energy product sold(3) g CO2e/MJ2015 VS 2015 |
Carbon intensity of energy product sold(3) g CO2e/MJ 2024 Carbon intensity of energy product sold(3) g CO2e/MJ2024 - 16.5% |
Carbon intensity of energy product sold(3) g CO2e/MJ 2025 Carbon intensity of energy product sold(3) g CO2e/MJ2025 - 17% NEW |
Carbon intensity of energy product sold(3) g CO2e/MJ 2030 Carbon intensity of energy product sold(3) g CO2e/MJ2030 - 25% |
| Indirect emissions(4) Mt CO2 | Indirect emissions(4) Mt CO2 2015 Indirect emissions(4) Mt CO22015 410 |
Indirect emissions(4) Mt CO2 2024 Indirect emissions(4) Mt CO22024 342 |
Indirect emissions(4) Mt CO2 2025 Indirect emissions(4) Mt CO22025 < 400 |
Indirect emissions(4) Mt CO2 2030 Indirect emissions(4) Mt CO22030 < 400 |
Since 2015: more energy, less emissions, more returns to shareholders

Evolution of indicators (base 100 in 2015) - projections until 2030:
Energy production: sharp increase (projected to reach 140 in 2030).
Dividend: gradual growth until 2024, then slight increase.
Carbon intensity, life cycle*: gradual decrease, around 75 in 2030.
Scope 1 + 2: gradual reduction, projected to be around 60 in 2030.
Methane emissions: sharp reduction, reaching a level close to 20 in 2030.
SINCE 2015
- Growing in electricity: equivalent to 10% of Oil & Gas production in 2025 and 20% of production mix in 2030
- Pre-dividend organic cash breakeven(1) decreased from >100$/boe to 25$/boe
- Interim dividend growth: +39%
- Most profitable Major for 3 consecutive years(2)
- Gearing reduced from 31%(3) to 8%
Looking to find out more about the biodiversity action plans rolled out at our sites? About our objectives on reducing water withdrawal in water stressed regions? And about how we are creating local jobs linked to our projects and contributing to the socio-economic development of the countries in which we operate?
Transition strategy, sustainable climate and energy, and more besides, in the
Sustainability & Climate - 2025 Progress Report